
Title:Application of Virtual Instrumentation
Displayed Name:Shankar Banavasi
| Concept / Overview |
|---|
| This project studies how application of virtual instrumentation in power systems laboratory can help reduce financial costs used to invest on physical devices like cathode ray oscilloscope, digital multimeters among other devices. It tries to address issues concerning how a student can conduct remote laboratory experiments and gain hands-on experience. At the same time, the directed study also tries to explain the difference between conducting remote laboratory experiments and running simulations. The distance Laboratory system project is a precursory effort to provide Power Engineering laboratory services over the Internet. The distance laboratory enables dynamic data monitoring, parameter modeling for analysis and basic control of a power engineering system that includes a dynamometer providing mechanical load, a four pole squirrel cage induction motor and an adjustable speed drive. Data acquisition, data processing and analysis and graphical unit interface enabled device characterizes the remote power laboratory. The project work comprises designing a computer network interface to the power engineering system to allow students to access, record and analyze data parameters and control the power system for conducting laboratory experiments. |
INTRODUCTION
The data acquisition and parameter modeling is implemented using Labview 6.0 software from National Instruments. The hardware equipments used are an Adjustable Speed Drive (Square D) manufactured by Schneider Electric. The hardware set up also consists of a four-pole Squirrel Cage Induction Motor coupled to a Prime Mover/Dynamometer manufactured by Labvolt Systems. Hardware devices like SCB-68 Pin Connector block and Data Acquisition (DAQ) 6052E PCI/PXI card are used. Additionally, due to the time-sensitive nature of the Internet, I propose to develop an Internet model to be developed for performance parameters like end-to-end delay and throughput. My intention is to analyze the Speed –Torque characteristics of a four-pole squirrel cage induction motor whose rotor terminals are connected in star. The results will show that the remote power laboratory allows students to obtain real data by wiring a real circuit in the laboratory using ―Square D‖ labdrive. The intention of remote power laboratory is to provide hands-on real world Web based experience to the student. The web-based model allows for flexibility and spontaneous delivery of laboratory material and ensures a global access to a worldwide audience. Computer-based data acquisition systems play an important role in clinical monitoring and in the development of new monitoring tools. LabVIEW is a data acquisition and programming environment that allows flexible acquisition and processing of analog and digital data. The main feature that distinguishes LabVIEW from other data acquisition programs is its highly modular graphical programming language, 'G,' and a large library of mathematical and statistical functions. LabVIEW uses a large amount of processing power and computer memory, thus requiring a powerful computer. It is excellently suited for testing new monitoring paradigms, analysis algorithms, or user interfaces.
THE LABVIEW SYSTEM
The LabVIEW system is a software environment for data acquisition and control originally conceived and developed on a Macintosh computer (Apple Computer, Cupertino, CA) and introduced in 1986 [7]. LabVIEW is an acronym for Laboratory Virtual Instrument Engineering Workbench. It was invented by Jeff Kodosky at National Instruments Corporation. LabVIEW combines two concepts, namely dataflow and structured programming and presents the result as a tool to construct ―virtual instruments‖—software modules that acquire, process and display measurements much like conventional bench-top instruments [7]. It has evolved from a program that could send, receive and integrate data to and from laboratory instruments equipped with a GPIB (general purpose interface bus, conforming to the IEEE-488 standard) into a system that can accept data in both analog and digital formats, and perform data analysis and instrument control. It was the first software program to include graphical, iconic programming techniques, which make the form of programming more transparent and the sequence of processing visible to the user. The latest release of LabVIEW (version 7.1) is available on three computing platforms: Apple Macintosh, DOS/Windows XP and Sun Workstations. Applications developed on one of these platforms can run on another platform with no or only minor modifications.
The main feature that distinguishes LabVIEW from other data acquisition programs is the graphical programming language (―G‖). It comes with a huge library of mathematical, statistical and digital signal processing (DSP) functions. Graphical programming means that statements, variables and functions are represented by on-screen icons and ―wires‖ rather than by lines of text. In a LabVIEW program, execution is not controlled by the order in which the statements were written in the source code (line-oriented programming) but, rather, by the data that are generated (data flow oriented). For example, subroutines that originates from an analog to digital conversion board as input does not execute until the data has been acquired.
The developers of LabVIEW have consistently used the metaphor of a VIRTUAL INSTRUMENT (VI, mimicking real-word measurements). A LabVIEW virtual instrument consists of a front panel ( the user interface) that can both accept input from the user ( sliders, knobs, values entered from the keyboard, push buttons, selector switches, etc) and present output to the user (indicators, LEDS, graphs, strip charts, sounds). A LabVIEW program (called diagram) somewhat resembles the schematic for an electronic circuit. Wires represent variables that hold data. The various processes that act on these variables are represented by icons (small graphic objects that suggest the operation they perform). All basic elements of conventional programming languages are implemented. For example, CONDITIONAL BRANCHING (IF….THEN….ELSE) is represented by a CASE structure. Repetitive operations can be put into FOR….NEXT OR WHILE loops. In LabVIEW, this literally means moving all of the relevant statements within the screen boundaries of a graphic element that represents the loop.
CREATING A LABVIEW PROGRAM
The creation of a LabVIEW program (virtual instrument or VI) starts with determining which variables will serve as inputs and placing them on the front panel as controls. A wide selection of customizable graphic elements is available to represent numeric controls, text (string) controls, pop-up menu controls, picture ―ring‖ controls, or picture Boolean controls. Similarly, the outputs from the program are placed on the front panel. Again, the output may be in numerical, textual or graphical form. The programmer then switches to the underlying diagram, where the newly placed front panel controls and indicators are represented as rectangular boxes. Color and a number inside the box denote data type and precision (INTEGER or FLOATING POINT). The programmer selects functions or subroutines (subVIs) from pull-down menus and connects input and output terminals with the functions using a special cursor, the wiring tool. Color and line thickness of the wires provides information on the data type. Wires representing integer numbers are represented in blue, while FLOATING POINT NUMBERS are represented in orange. Arrays are represented by thicker wires; parallel wires represent multidimensional arrays. Repetitive operations are placed inside a WHILE or FOR-NEXT loop as appropriate. Conditional branching is achieved with the CASE structure, by wiring the condition (either a Boolean TRUE or FALSE or an integer number) to the condition terminal, a green question mark. Inside the CASE structure, each of the CASE structure, each of the CASEs can be filled with the appropriate actions or subroutines (subVIs). Since it is not possible to have all of the cases visible at the same time, a control at the top border of the CASE structure allows the programmer to step through and inspect the contents of the various case alternatives. When printing a diagram for documentation, the contents of each case can be printed separately. DEBUGGING is facilitated by the fact that each VI or subVI is a separate program that can be run independently from the calling (main program) by setting the front panel controls and inspecting the results.
Rearranging screen objects can be easily accomplished and connecting wires will try to adapt in a logical way. The programmer can improve diagram legibility by minimizing screen clutter and by avoiding crossing of wires or wires that cross under, rather than terminate in functions or subVIs. Some drawing tools like alignment and distribution are available to help streamline the appearance of diagrams and front panels.
LABVIEW Example: A simple Voltage and Current Averager:
Figure 1 is a block diagram which shows a ―G‖ program of a basic voltage and current signal averaging virtual instrument. Analog signal averaging is at the heart of many programs used for acquisition of evoked potentials (EPs). The program generates waveforms of voltage and current produced by a four-pole squirrel cage induction motor which is coupled to a prime mover. The terminals of the Induction Motor are connected to the terminals of an electronic device called as Square D. Square D is instrumental in driving the induction motor at particular frequencies. The program uses a WHILE loop that continues until the specified number of sweeps has been acquired. A shift register positioned on the boundaries of the loop holds the summation waveform array. Shift registers are a convenient way to ―remember‖ data values acquired or calculated in previous iterations of loops. Data enter the shift register on the right side of the loop, and are available at the left terminal during the next iteration. A CASE structure is used as part of the algorithm. A dedicated subVI tests each in-coming
sweep to determine whether one or more of the criteria are met. The result is a BOOLEAN variable (TRUE or FALSE). Only when the criterion is not met (CASE selector =FALSE) will the most recently acquired values be added to the digital multimeter display board.
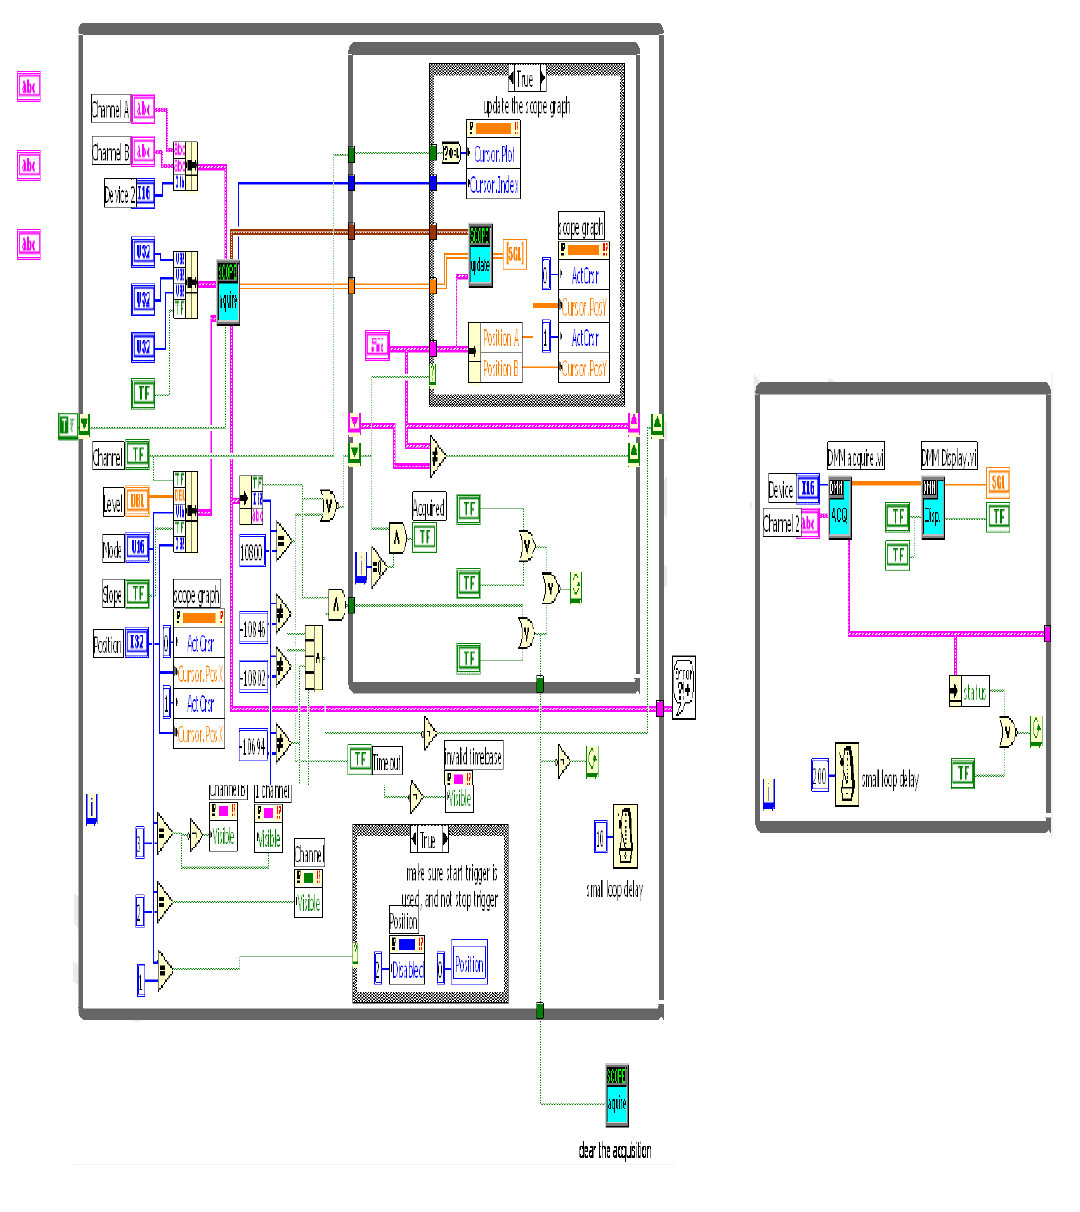
Figure 1: “G” program of a basic voltage and current signal averaging virtual instrument
Ease of Programming and Documentation
LabVIEW code is quite flexible and reusable. Virtual Instruments (VIs) can be nested almost indefinitely. The programmer can design icons for each VI or subVI and can determine which front panel controls and indicators will be used as terminals to receive or supply data. SubVIs can be set to perform their calculations only or to open their front panel when called. VIs can be shared among many applications. For example, a digital filter VI might use an array of integer numbers, a cutoff frequency, and slope as inputs and provide the digitally filtered data at the output. This VI needs to be written only once. It can then be reused in several programs. Another important aspect of LabVIEW is that many operations show POLYMORPHISM [8]: addition, subtraction, multiplication, division and even some of the more complex operations accept any data type on their inputs. For example, a numeric array may be multiplied by a single number or two arrays may be multiplied by each other, all by ―wiring‖ those to the same multiplication function icon.
A common problem with line-oriented program languages is that unless one meticulously documents every statement and function, the program may rapidly become incomprehensible, not only for others, but, after some time, even for the programmer who designed the program. LabVIEW, by nature of its graphical programming syntax, provides almost self-documenting code, that is, one can usually deduct the function of the program by following the wires to and from the various functions and subVIs. In addition, each control, indicator, wire or function can be individually commented without cluttering the diagram. The comment can be made visible by clicking on the function. The current version of LabVIEW does not allow collecting and indexing individual comments in a list. Front panels, diagrams and the hierarchy of subroutines can be printed. Optionally, the contents of the various CASE alternatives can be individually printed.
PROJECT OBJECTIVES AND DESCRIPTION
For this project, the objective is to design and build a prototype experiment, using automated, interactive instrumentation, accessible and controllable through the Internet. In other words, this project should enable a distance education student to have a real time, graphical interface to a working laboratory experiment. The interface must be accessible, observable and controllable from the student’s remote location.
Fig 2 shows the front panel in Labview illustrating how the system operates. Information flows in both directions. The experiment itself is an induction motor powered through an Adjustable Speed Drive (ASD). Appropriate instruments, in this case, an oscilloscope and a power supply, gather the data. Through a General Purpose Interface Bus (GPIB), the instruments send their data to a personal Computer (PC)-based server running LabView software. The server processes the data and formats it for transmission over the internet and displays on the remote user’s monitor. The remote user may also send commands over the Internet to the server. The server translates these commands using LabView and sends appropriate instructions through the GPIB for the power supply and oscilloscope. The power supply then generates relay signals to energize the experiment and also creates appropriate speed signals for the ASD. This prototype system was designed in three phases, as described in the next section.
Design Methodology
Meeting the design objective proceeded in three phases.
Phase 1: Real time display of experimental voltage and current waveforms
Phase 2: Real time audio and video display of the experiment.
Phase 3: Real time control of the experiment: power on/off and motor speed adjustment.
Phase 1: Waveform Display Using
Labview For this project, Labview performs two major tasks. First, Labview processes commands to control the instruments. Second, Labview gathers the data and processes it for display in a graphical format on a computer monitor.
Labview uses a pictorial solution to the programming problem. It creates programs called Virtual Instruments (VI) in block diagram format using a graphical programming language,’G’. Each VI, being based on an icon-based modular programming approach, can be run by itself or can be a part of another VI called a subVI.
GPIB, a bus interface system, enables Labview to interact wit the instruments. This project employs the GPIB features of Labview, including a library of applicable functions through which the server and instruments communicate. GPIB is the platform for communication for instrument I/O operations. The Labview VI does the control and the data displays. The Labview front panel is analogous to a physical instrument panel, representing in graphical form a convenient user interface to the Labview VIs.
For this project, the first task is to design and build appropriate VIs to control and operate the instruments, the oscilloscope and the power supply. Controlling the experiment from the computer using Labview in its ordinary local operating mode, just as an on-campus student might be expected to do, is the first milestone. Procedures to do this, including the use of library functions and user-generated VIs are documented in the Labview manuals.
Labview versions 4.0 and higher include Internet interface software. Among this software is a server package that can receive an input from the Internet at the server and then directly convert that input into a Labview command for the measurement instruments. In addition to the server software, the server also must have a Hypertext Markup Language (HTML) file that is a locally generated ―webpage‖. This HTML file contains the Labview VI front panel along with other information pertinent to the experiment at hand. The remote user downloads this ―webpage‖ to gain an interface to the server, both to enter commands and to receive measurement data.
ADVANTAGES OF USING LABVIEW
a) When Labview is used, one would not have to conduct any measurements or worry about not being exact when trying to produce certain measurements as the software records all the data
b) Using virtual instruments, one can simulate an experiment, develop mathematical model and display experimental results simultaneously thereby saving a lot of time
COMPUTER INTERFACE SETUP
The user interface was designed on the basis of having friendly interaction between the students and the computer. It was implemented in the LabVIEW environment since it combines the advantages of graphical programming and high-quality user interface tools.The user interface or ―front panel‖ of LabVIEW has ready-to-go controls, such as graphs, knobs and switches that can be manipulated by the programmer. The front panel can be constructed and viewed like a physical instrument where the student can visualize the results on the computer screen. The front panel is driven by the G-language code or ―block diagram‖ which is the actual code of the program. This part of the Virtual Instrument (VI) receives data from the front panel and sends them to the main program. The hardware interface to the computer is a National Instruments, multifunction, low-cost data acquisition (DAQ) card. The DAQ card has 16 analog inputs in a single-ended mode or eight in a differential mode and two analog outputs. The DAQ card used is 6052E PCI-MIO-16E-4 in which the sampling rate for an analog input is 333kS/s and has an accuracy of 12b.
LABORATORY SETUP
The laboratory setup is situated at Power Quality Research facility, department of Electrical and Computer Engineering, Wallace Hall, Wichita State University.A four-pole squirrel cage Induction Motor is connected to Prime Mover/Dynamometer. The induction motor is run from an automated labdrive device (Square D) which supplies 60 Hz, 220V, 3-phase supply to the stator of the induction motor. The rotor of the induction motor is connected in star. The voltage terminals of the rotor are connected to pin numbers 31 and 65 on an SCB-68 pin connector block. The SCB-68 pin connector block is in turn connected to the DAQ device of PCI-MIO-16E-4 board. Pin numbers 31 and 65 correspond to analog input channel 2 in Measurement and Automation Explorer, Version 2.0 which is a part of Labview. The current is measured on labVIEW by connecting current transformer terminals to pin numbers 30 and 63 which correspond to analog input channel 3 in Measurement and Automation Explorer, Version 2.0. Analog input channels 2 and 3 are configured to operate in differential mode. The torque output and speed output terminals are observed from the prime mover/dynamometer. The torque output is connected to pin numbers 28 and 61 on the SCB-68 pin connector block as torque values are read in through analog input channel 4. Pin numbers 28 and 61 corresponds to analog input channel 4 which is configured to operate in the differential mode. The speed output from the prime mover is connected to pin numbers 60 and 26 on the 68-pin connector block as analog input channel 5 is used. It is configured to operate in differential mode as well. The above listed pin numbers corresponding to the physical parameters (like voltage, current, etc) are found out by configuring the DAQ device through measurement and automation explorer. Each variable is read through a unique analog input channel which is then used to display using charts, graphs and digital multimeter on the LabVIEW front panel.
Phase 2: Real time audio and video display of the experiment
The following table shows the actual range and measurement precision of PCI-MIO-16E-4 DAQ card:
| RANGE CONFIGURATION | GAIN | ACTUAL INPUT RANGE | PRECISION1 |
| 0 to +10V |
1.0 2.0 5.0 10.0 20.0 50.0 100.0 |
0 to +10V 0 to +5V 0 to +2V 0 to +1V 0 to +500mV 0 to +200mV 0 to +100mV |
2.44 mV 1.22 mV 488.28 μV 244.14 μV 122.07 μV 48.83 μV 24.41 μV |
| -5 to +5V |
0.5 1.0 2.0 5.0 10.0 20.0 50.0 100.0 |
-10 to +10V -5 to +5V -2.5 to +2.5V -1 to +1V -500 to +500mV -250 to +250mV -100 to +100mV -50 to +50mV |
4.88 mV 2.44 mV 1.22 mV 488.28 μV 244.14μV 122.07μV 48.83μV 24.41μV |
| 1The value of 1 LSB of the 12-bit ADC, that is, the voltage increment corresponding to a change of one count in the ADC 12-bit count. | |||
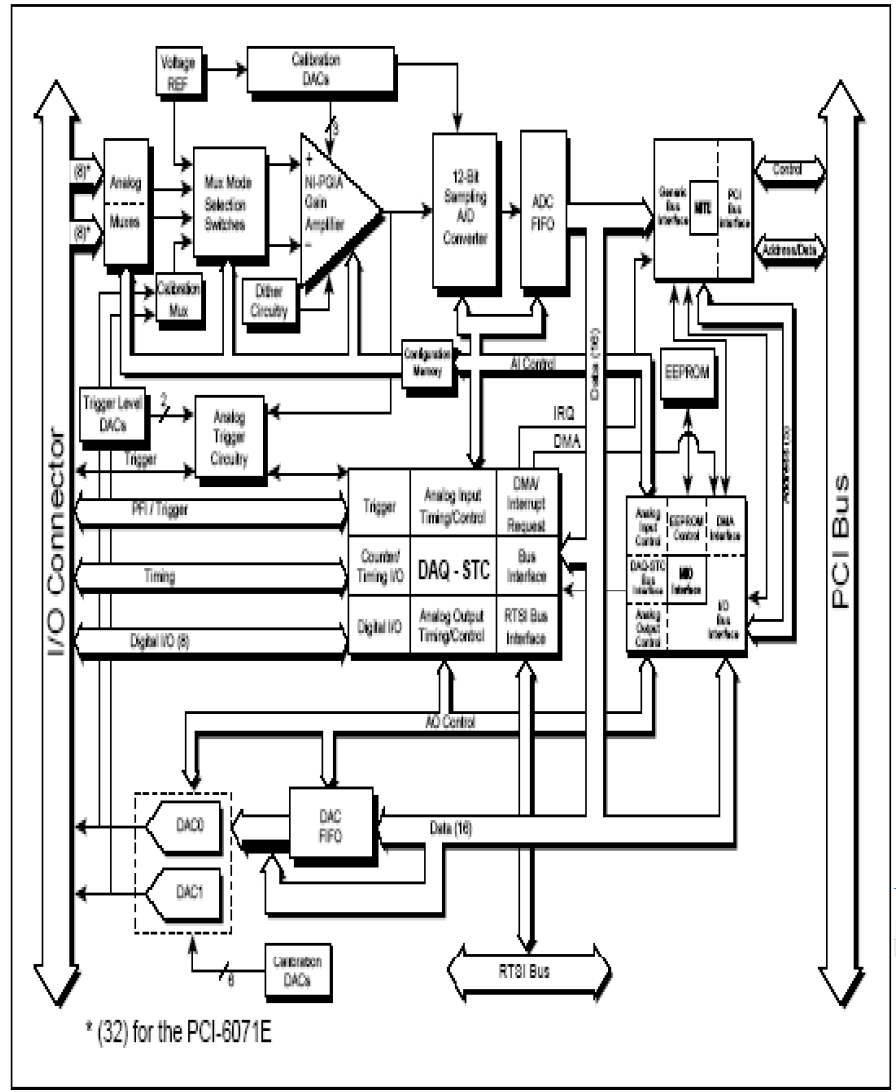
Figure 2: PCI-MIO-16E-4 Block Diagram
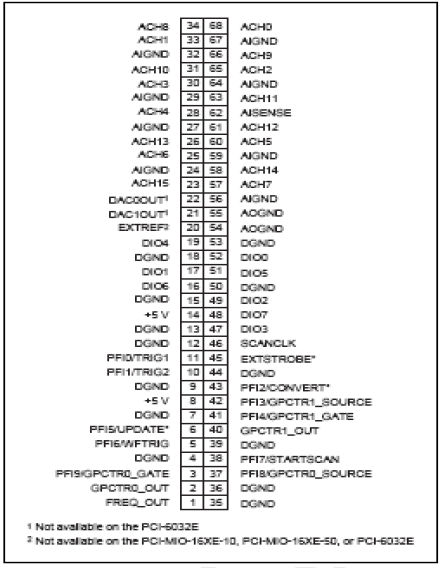
Figure 3: I/O Connector Pin Assignment for PCI-MIO-16E-4
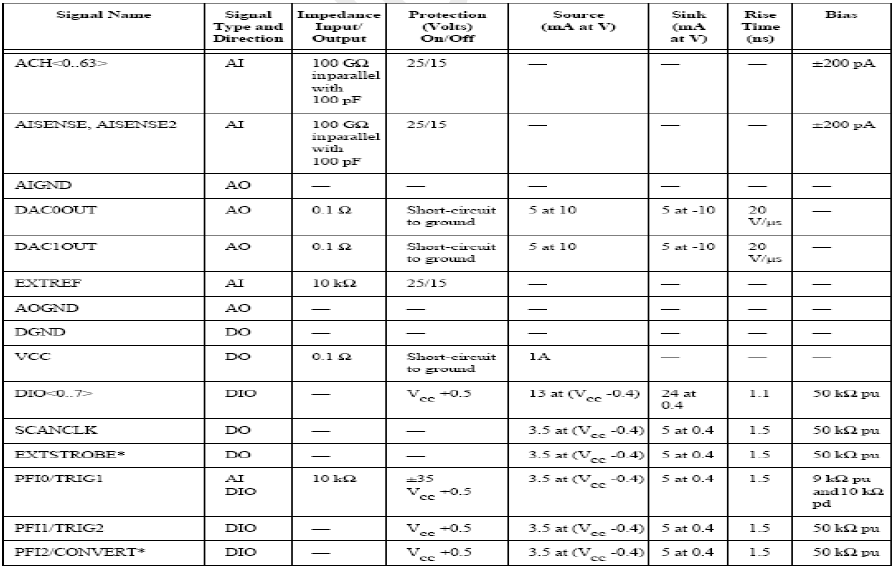
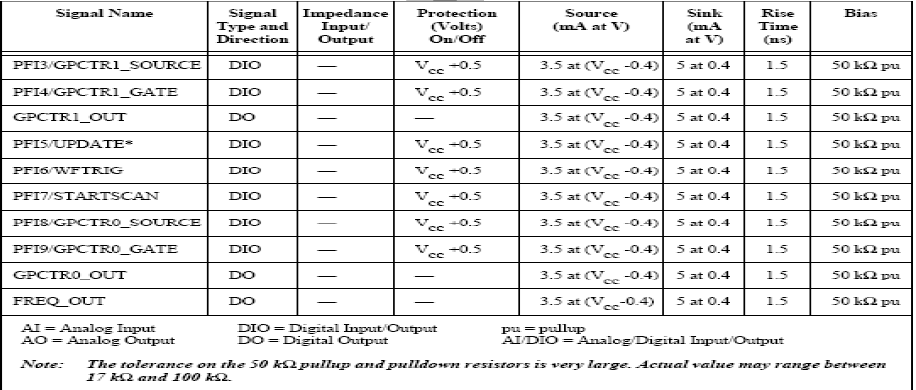 Figure 4: I/O Signal Summary for PCI-MIO-16E-4
Analog Input Signal Connections
The analog input signals for the PCI-MIO-16E-4 board are ACH<0…15>, AISENSE and AIGND. The ACH<0…15> signals are tied to the 16 analog input channels of the PCI-MIO-16E-4 board. In single-ended mode, signals connected to ACH<0…15> are routed to the positive input of the board PGIA. In differential mode, signals connected to ACH<0...7> are routed to the positive input of the PGIA and signals connected to ACH<8…15> are routed to the negative input of the PGIA.
Types of Signal Sources
When configuring the input channels and making signal connections, we must first determine whether the signal sources are floating or ground-referenced. The following sections describe these two types of signals.
Floating Signal Sources
A floating signal source is not connected in any way to the building ground system but, rather, has an isolated ground-reference point. Some examples of floating signal sources are outputs of transformers, thermocouples, battery-powered devices, optical isolator outputs and isolation amplifiers. An instrument or device that has an isolated output is a floating signal source. The ground reference of a floating signal must be tied to PCI E Series board analog input ground to establish a local or onboard reference for the signal. Otherwise, the measured input signal varies as the source floats out of the common-mode input range.
Ground-Referenced Signal Sources
A ground-referenced signal source is connected in some way to the building system ground and is, therefore, already connected to a common ground point with respect to the PCI E series board, assuming that the computer is plugged into the same power system. Nonisolated outputs of instruments and devices that plug into the building power system fall into this category. The difference in ground potential between two instruments connected to the same building power system is typically between 1 and 100mv but can be much higher if power distribution circuits are not properly connected. If a grounded signal source is improperly measured, this difference may appear as an error in the measurement. The connection instructions for grounded signal sources are designed to eliminate this ground potential difference from the measured signal.
Adjustable Speed Drive(Square D):
An ALTIVAR 28 family of adjustable frequency AC drive controller is used as part of the laboratory setup. The drive controller is usually used for controlling three-phase asynchronous motors. They range from:
- 0.5 to 3hp (0.37 to 2.2kW) 240V, single-phase input.
- 5 to 10hp (3 to 7.5kW) 230V, three-phase input
- 1 to 20hp (0.75 to 15kW) 460/480V, three-phase input [10]
In the diagram as shown in the next page, three things need to be taken care of before going ahead with the connections. They are:
(1) Line Inductor, if used (single phase or 3-phase).
(2) Safety relay contacts, for remote indication of the drive controller status.
(3) Internal +24V. If an external +24V source is used, connect the 0V from that source to the COM terminal and do not use the +24 V terminal on the drive controller.
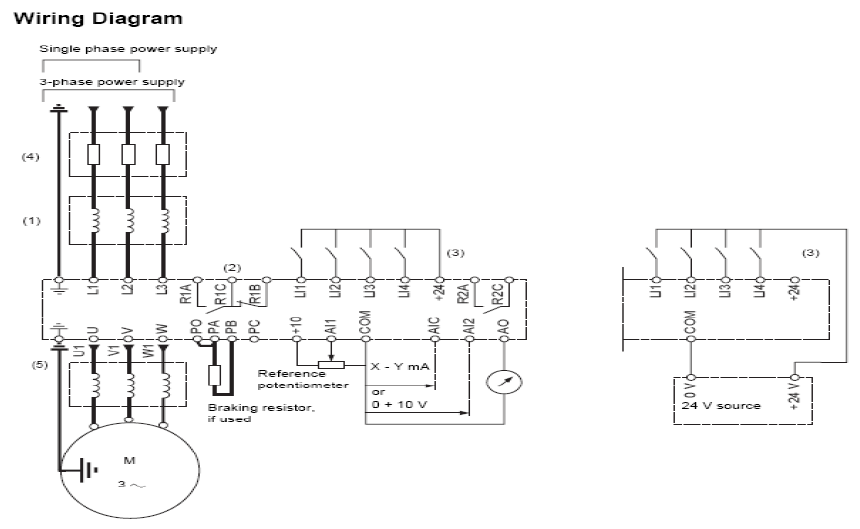
Figure 5: Wiring diagram of Adjustable Speed Drive
CONTROLS, CONNECTORS AND INDICATOR SPECIFICATIONS OF DYNAMOMETER
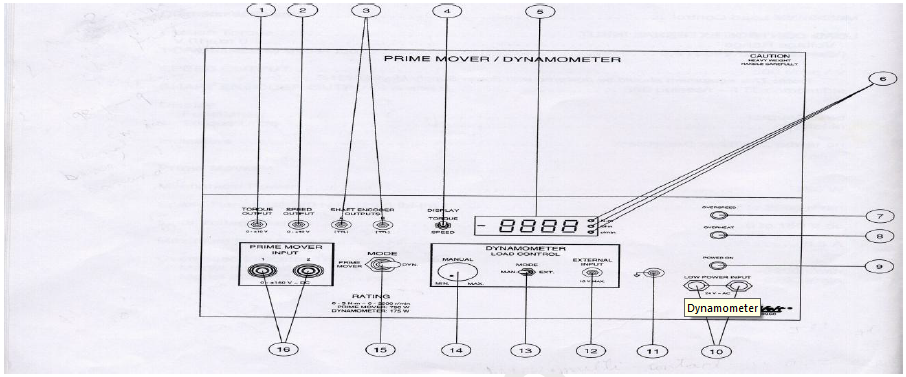 Figure 6: FRONT PANEL OF THE PRIME MOVER/DYNAMOMETER, MODEL 8960-1, LAB-VOLT SYSTEMS Inc.,
A) Terminal #1 from the panel diagram is the TORQUE OUTPUT terminal:
This miniature banana jack provides a voltage that is proportional to the torque developed by the machine coupled to the Prime Mover/ Dynamometer
B) Terminal #2 from the panel diagram is the SPEED OUTPUT terminal:
This miniature banana jack provides a voltage that is proportional to the rotation speed of the Prime Mover/ Dynamometer.
C) Terminals #10 from the panel is the LOW POWER INPUT terminal:
These two jacks are used to supply 24-V ac power to the Prime Mover/ Dynamometer. Either jack can be used since they are internally connected in parallel. 24-V ac power is available on the Power Supply.
D) Terminal #11 from the panel is the COMMON terminal:
This miniature banana jack is connected to the common point of the electronic circuitry in the Prime Mover/ Dynamometer. This common terminal is used in conjunction with the torque and speed outputs when performing torque and speed measurements with a Lab-Volt Data Acquisition and Management system. It is also used when performing external control of the mechanical load in the dynamometer mode of operation, as well as when using shaft encoder outputs A and B for measuring the rotation speed.
E) Terminal #14 from the panel is the dynamometer manual:
Load control knob: This knob is used to set the mechanical load which the dynamometer produces when the manual load control mode is selected. The mechanical load increases as the knob is turned clockwise
and vice versa.
F) Terminal #15 from the panel is the MODE selector :
This switch allows the operating mode of the Prime Mover/ Dynamometer to be selected. The module operates as a prime
mover when the switch is set to the PRIME MOVER position and as a dynamometer when the switch is set to the DYN. Position.
Phase 3: Real time control of the experiment: power on/off and motor speed adjustment
The real time control of the experiment can be attained by implementing virtual instrument
programs namely, two channel Oscilloscope.vi and simple digital multimeter.vi.
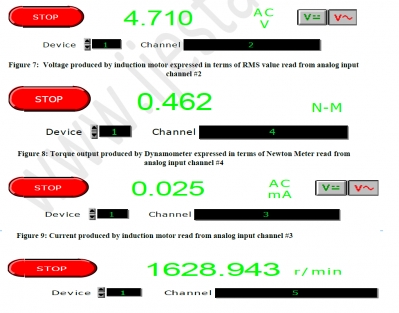
RESULTS
Four Pole Squirrel Cage Induction Motor Characteristics:
One of the VIs developed makes it convenient to measure parameters like voltage, current,
torque and speed. The results obtained after running the program in labVIEW are as shown:
 Figure 10: Speed characteristics of Dynamometer expressed in terms of rotations/minute read from analog input channel #5
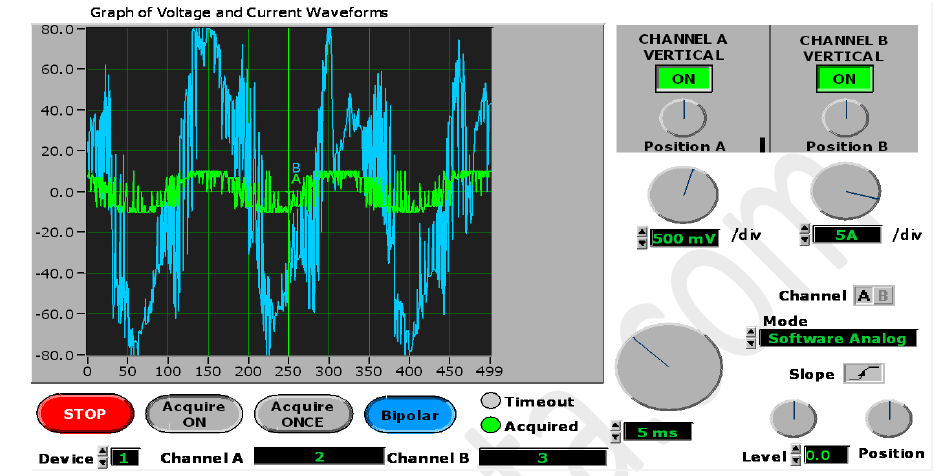 Figure 11: Voltage and current characteristics of four-pole induction motor observed on a virtual two channel oscilloscope
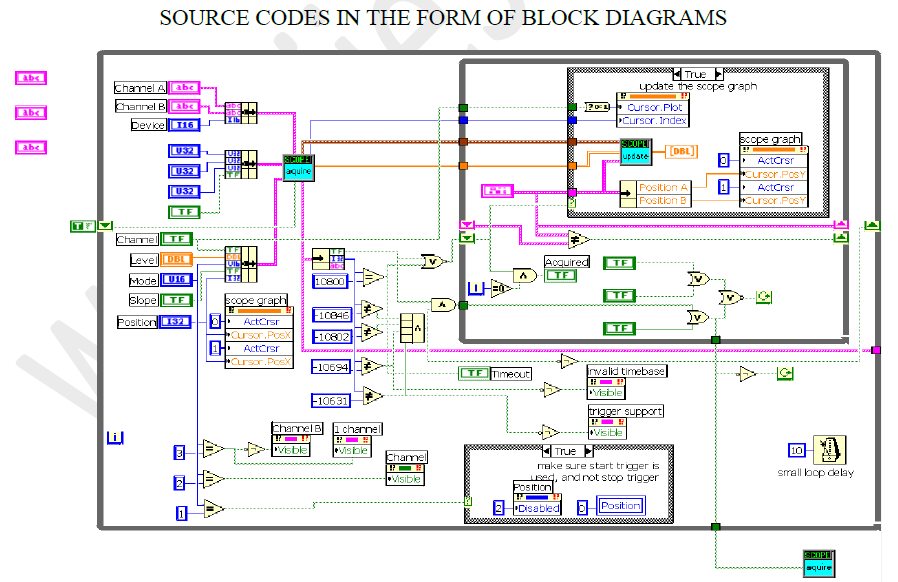 Figure 12: G program for continuous acquisition of voltage and current waveforms on a virtual two-channel oscilloscope
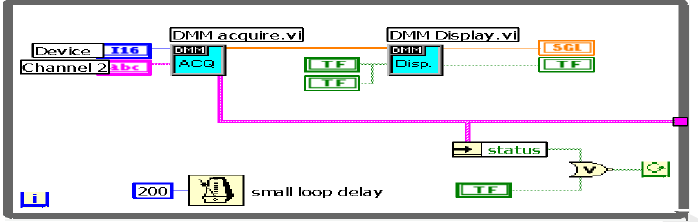 Fig 13: G program to display RMS values of voltage developed from the rotor terminals of four-pole induction motor
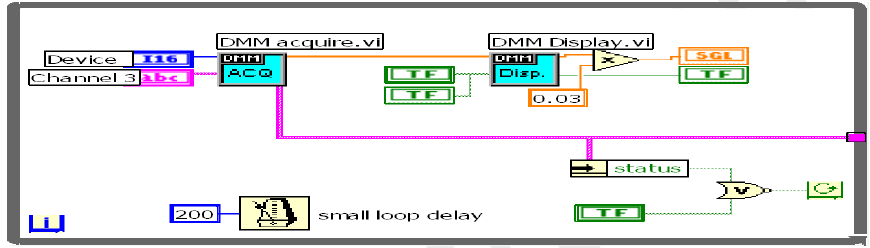 Figure 14: G program to display RMS values of current developed from the rotor terminals of four-pole induction motor
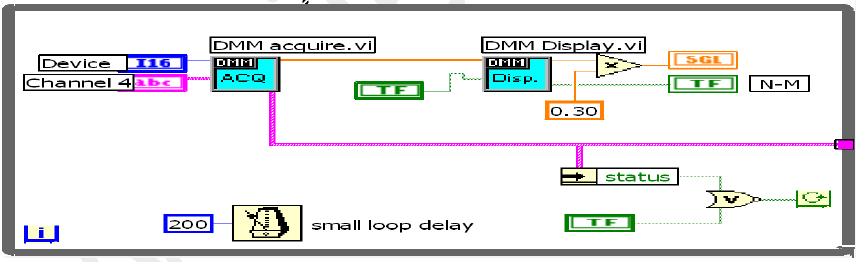 Figure 15: G program to display the torque produced by dynamometer
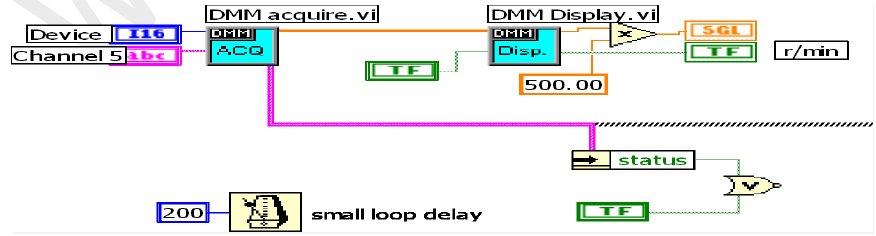 Figure 16: G program to display the speed produced by dynamometer
CONCLUSION:
This project has developed a Labview implementation of acquiring electrical parameters like voltage, current, torque and speed of a four-pole induction motor coupled to a prime mover/dynamometer set. The use of virtual instrumentation not only provides a method for students to perform experiments without using physical devices like cathode ray oscilloscope and digital multimeter but helps reduce the amount of time necessary to make connections. The real time display of quantities such as phasor voltages and currents, torque and speed helps in the students’ ability to better understand and implement experiments in the field of electrical machines laboratory. Students can conduct physical experiments from remote locations. It is possible to imitate traditional laboratory exercises. The only difference is that students will not handle components and test probes with their fingers. One can anticipate that computer-based instruments with virtual front panels will gradually replace physical laboratory set ups. It thus makes no difference if one handles instruments in local labs or by remote control. Nevertheless, students need a great deal of hands-on practice. A methodology to cope with real-world problems such as finding bad connections is an issue. Another issue is how can we convince a student who will never see the hardware that s/he will use that remote experiments are not simulations? This can be addressed by using devices like web camera and build a java servlets based website which can help students see the actual laboratory set up. Due to time constraints, this project helps in the virtual instrumentation of physical devices to assist conducting electrical machines related laboratory exercises. However, it should be easier for electrical and computer engineering to understand a description of the laboratory and how it works.
FUTURE WORK
Future work on this project can be done by building an internet interface with a client-server architecture implemented using Apache v1.3.27, MySQL v3.23.53 and PHP v4.2.3 (known as LAMP architecture). A website can be designed with the help of HTML and Java script. This website can then act as an interface between the student and physical laboratory in order to carry out experiments remotely. In addition, as part of future work, Internet model to be developed for performance parameters like end-to-end delay and throughput can be proposed.
APPENDIX
Equations used to calculate torque, speed and current to express in actual units in labVIEW are as follows [11]: Torque output from dynamometer = 0.3 Nm
Speed output from dynamometer = 500r/min/V
Current transformer ratio for four-pole induction motor = 0.025 V/ A.
ACKNOWLEDGEMENTS
I would like to thank Dr. Ward T. Jewell for his able guidance through out the directed study. I am thankful to National Instruments and the Department of Electrical and Computer Engineering, Wichita State University for providing me opportunity and resources to carry out this directed study.
REFERENCES
i ―Using Automated Instrumentation and Available Software to provide Interactive Laboratory Instruction to Distance Education Students on the Internet‖ by Jason Dutcher, Baber Raza, Robert Rippy, Jang Yi, Herbert Hess Department of Electrical Engineering, University of Idaho
ii ―A Quantitative Analysis of the Data Acquisition Requirements for Measuring Power Quality Phenomena‖ by Shiun Chen
iii ―An Introduction to Labview Exercise for an Electronic Class‖ by Melanie L. Higa, Dalia M. Tawy and Susan M. Lord
iv ―Motor Current Signature Analysis‖ by P. Pillay and Z.Xu, Clarkson University, ECE Dept, P.O.Box 5720, Potsdam, NY 13699-5720
v ―Software development for the Hobby-Eberly Telescope’s segment Alignment Maintenance System using Labview‖ by Drew Hall, William Ly, Ricky Howard, John Weir, John Rakoczy NASA Marshall Space Flight Center Huntsville, Alabama
vi ―An Automated System for Frequency Response Analysis with Application to an Undergraduate Laboratory of Electrical Machines‖ by F.S. Sellschopp and Marco A. Arjona L., Associate Member, IEEE
vii LabVIEW for everyone: Graphical Programming Made Even Easier by Lisa K. Wells, Jeffrey Travis.
viii LabVIEW Graphical Programming: Practical Applications in Instrumentation and Control by Johnson Gary W., Gary W. Johnson
ix Application of Virtual Instrumentation in a Power Engineering Laboratory by Qamar H. Arsalan, Amanda Filbeck, Thomas W. Gedra, School of Electrical & Computer Engineering, Oklahoma State University, Stillwater
x Adjustable Speed Drive (Square D) specifications by Schneider Electric
xi Prime Mover/Dynamometer Model 8960-1 Instruction Manual by Lab-Volt Systems
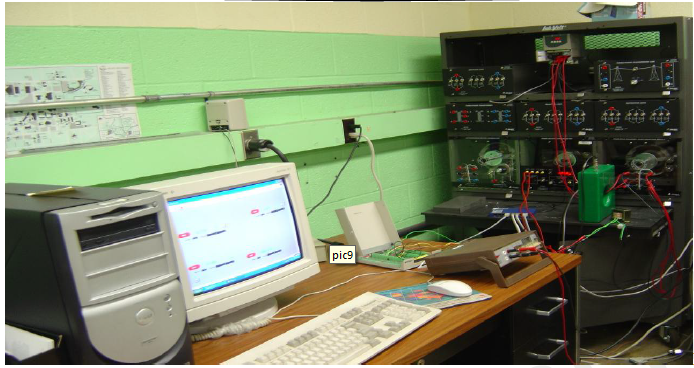
Figure 1a: Complete Setup Of Labview Exercise
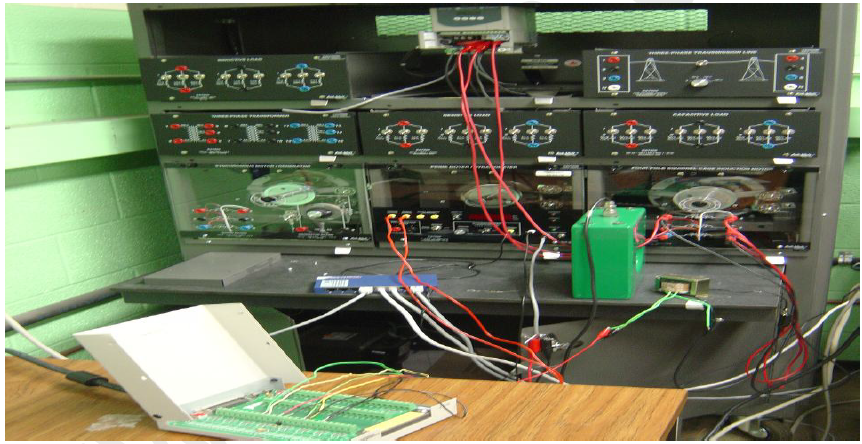
Figure 1b: Interface Connections Between Hardware And Software
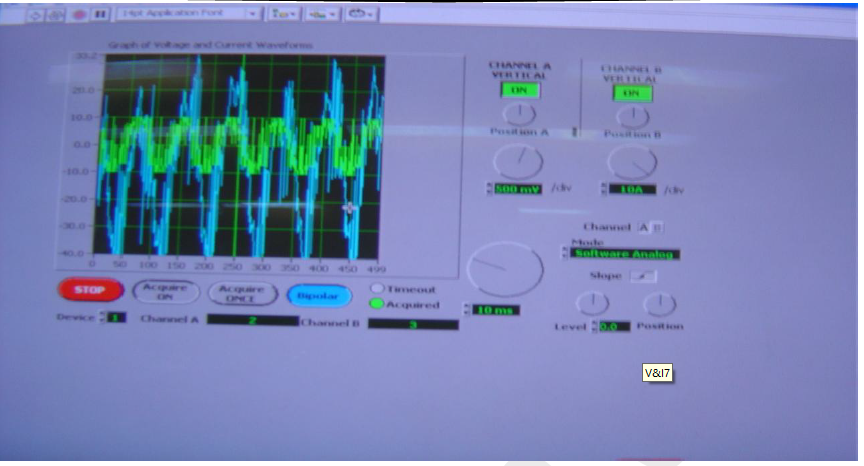 Figure 2a: Voltage And Current Waveforms As Observed On Labview
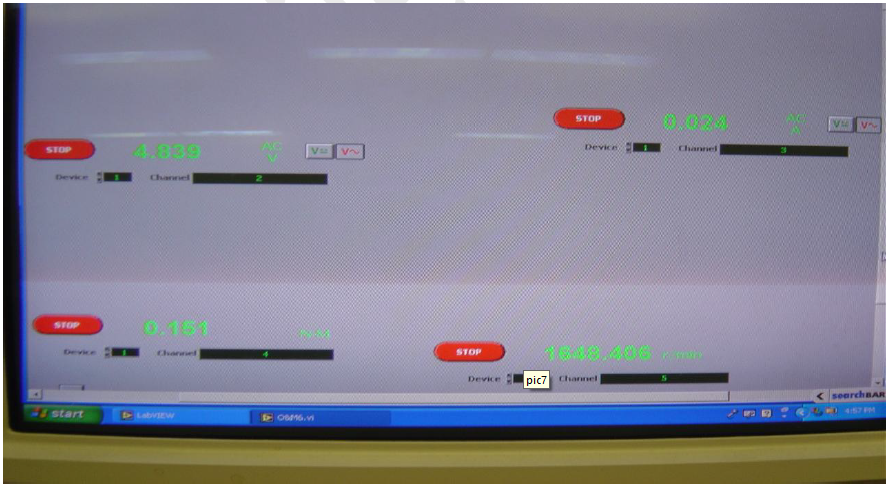 Figure 2b: Voltage, Current, Torque And Speed As Observed On Labview
Finalist on GR-PEACH Design Contest in India 2016
