Title:Space behavior analysis by heat map
Displayed Name:@takjn

| Concept / Overview |
|---|
| Many 2-dimensional behavior analysis tools using camera images and BLE beacons are already commercialized for flow line and stagnation analysis in actual spaces such as shops and offices. However, there are not many cases about action analysis in 3 dimensions (such as where the customers reach on the shelf). We built a system to perform a 3D behavior analysis using one GR-PEACH and two video cameras and have demonstrated the operation through prototyping. At this moment, we are not considering to commercialize this work. Many tools for the actual space behavior analysis are expensive and difficult to introduce in small stores and factories. We want to offer an infrastructure that anyone can build in a real space behavior analysis system using relatively inexpensive and easy-to-obtain GR-PEACH and open sourced methods and tools so that such stores and factories can improve their business spaces. Application examples of this prototype used in following offices or amusement places. Ex) Usage analysis of office conference rooms and monitoring overtime work on the target floor Ex) "VR painting" by walking around in real space Ex) "VR mole hunting" capturing a virtual mole in VR space by swinging a bat in real space |
Heat map
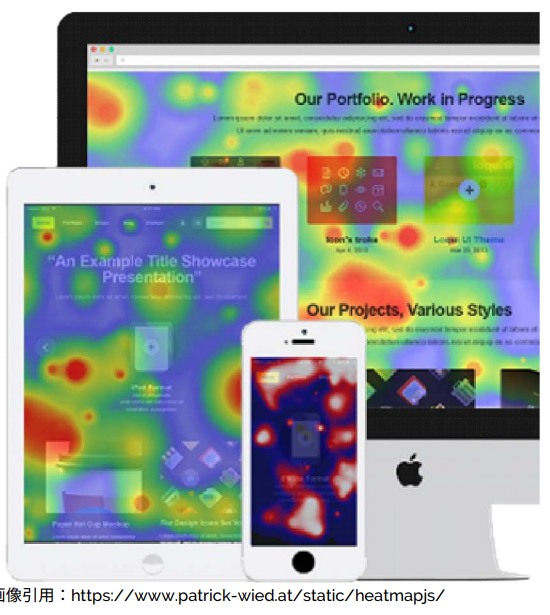
Are you familiar with the visualization method called the heat map?
This method visualizes the strength of numerical data with color. For example in Web applications, it is used as a method to visualize which part of the web page is seen most based on mouse movements. This method is also used as a visualization method of behavioral analysis in actual spaces such as store, office and factory. It is used for flow line analysis and stagnation analysis enabling store improvement and business improvement.

Prototype and system configuration
• In actual space behavior analysis, many 2-dimensional behavior analysis tools using camera images and BLE beacons are already commercialized. However, there are not many systems doing behavior analysis in 3 dimensions (such as where customers reach on the shelf).
• So we built a system to perform a 3D behavior analysis using one GR-PEACH and two video cameras and have demonstrated the operation with prototyping.
• We connected two NTSC cameras on GR-PEACH's two NTSC inputs. The first camera shoots the X-Z plane, and the second camera shoots the Y-Z plane. By combining the two camera images, we restore the spatial data (three-dimensional data of XYZ).
• The restored spatial data is saved in the cloud in chronological order and visualize the data using the heat map method.
System configuration:
By placing two cameras crossing 90 degrees, GR-PEACH restores spatial data in real time.
The recoverable space depends on the view angle of the lens.
The recovered spatial data is transmitted to the server in real time via the network and stored/managed on the server.
The spatial data on the server can be seen with a dedicated visualization tool.
Since camera images (personal data) do not flow on the network, the network bandwidth can be reduced and privacy issues that are problematic when handling camera images can be avoided.

Demo video
Description and source code
■ Outline of Demonstration Movie
The demo video is based on the actual operating prototype. We did not modify the video at all. Everything is processed in real time at the speed shown in the demo video.
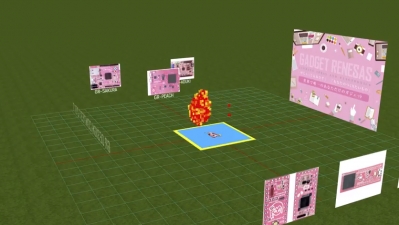
The area with no movement is red, the yellow area is where much motion occurs. I think you can see a heat map representing a person raising their arms up and down and walking and stopping.
This prototype video represents digital signage often placed where people shop. There are six panels (Gadget Renesas photo) in the area. When aperson stands in front of the Gadget panel, the panel display is magnified. This seems as if an invisible switch is placed on the floor. This system can be used to do a speech narration for a promotion item when someone stands in front of it.
This prototype can also be applied to surveillance or monitoring cameras. Since areas with no motion are displayed in red, it can be used for detecting suspicious persons and reporting systems.
■Prototype outline
The 3D spatial data which is the original data of the 3D heat map is generated in real time on GR-PEACH based on 2 camera images. The generated 3D spatial data is transmitted to the server in real time using WebSocket.
The 3D heat map is generated on the server based on the spatial data received from GR-PEACH. In order to maintain the real-time operation, this system holds 10-frame spatial data in on-chip memory instead of saving data to a database or storage.
The generated 3D heat map can be seen from the PC browser. You can see the results in real time from any viewpoint using a mouse. Although not included in the demo video, we also created a VR demo application using smartphones, which can be used for amusement applications. For example, you can walk around in the virtual space by actually walking around the real space with VR goggles shown in the demo video.
■ Prototype performance
In the demonstration movie, the actual space of 2m in width, 2m in depth and 2m in height is analyzed in 4cm intervals. The size and accuracy of analyzing actual space are a trade-off with the processing speed (real-time response rate). Due to the memory size limitation of GR-PEACH, the maximum size of the space that can be analyzed is about 10m in width, 10m in depth and 2m in height, in 5cm intervals.
The performance also depends on the communication speed and processing performance of the server. In the demonstration movie, I use a PC server operating in the same LAN of GR-PEACH instead of using a cloud server.
■ Reusability of deliverables
All source codes are published at GitHub (https://github.com/takjn/lofsil).
GR Design Contest 2017 Finalist
I am a Web system software engineer.
I am an amateur when it comes to hardware. I enjoy electronic work as a hobby.
the source code is released on GitHub. I await your Pull Request.

